With 5,000 tiny robots in a mountaintop telescope, researchers can look 11 billion years into the past. The light from far-flung objects in space is just now reaching the Dark Energy Spectroscopic Instrument (DESI), a project managed by the Lawrence Berkeley National Laboratory (LBNL), enabling us to map our cosmos as it was in its youth and trace its growth to what we see today. Understanding how our universe has evolved is tied to how it ends, and to one of the biggest mysteries in physics: dark energy, the unknown ingredient causing our universe to expand faster and faster.
To study dark energy’s effects over the past 11 billion years, DESI has created the largest 3D map of our cosmos ever constructed, with the most precise measurements to date. This is the first time scientists have measured the expansion history of the young universe with a precision better than 1%, giving us our best view yet of how the universe evolved. Researchers shared the analysis of their first year of collected data in multiple papers that will be posted today on the arXiv and in talks at the American Physical Society meeting in the United States and the Rencontres de Moriond in Italy. These are the first 4th generation results on dark energy.
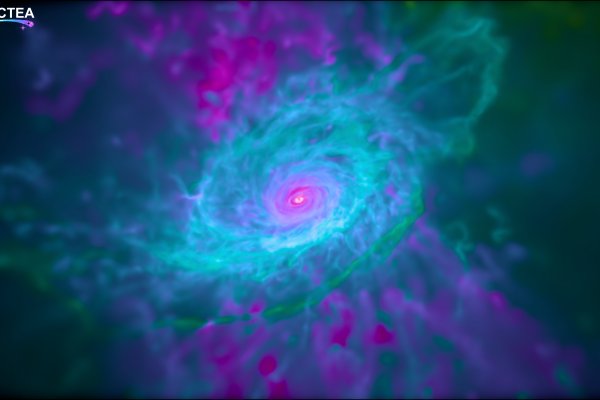
In this 360-degree video, take an interactive flight through millions of galaxies mapped using coordinate data from DESI. Credit: Fiske Planetarium, CU Boulder and DESI collaboration
“At the moment it looks like the first results from DESI are in agreement with the predictions of the current model”, said Hui Kong, postdoctoral researcher at IFAE, Barcelona, and main author of one of the studies made public today. “There are some hints pointing at small temporal variations in the density of dark energy, but we will need more data to confirm them.”
Our leading model of the universe is known as Lambda CDM. It includes both a weakly interacting type of matter (cold dark matter, or CDM) and dark energy (Lambda). Both matter and dark energy shape how the universe expands – but in opposing ways. Matter and dark matter slow the expansion down, while dark energy speeds it up. The amount of each influences how our universe evolves. This model does a good job of describing results from previous experiments and how the universe looks throughout time.
However, when DESI’s first-year results are combined with data from other studies, there are some subtle differences with what Lambda CDM would predict. As DESI gathers more information during its five-year survey, these early results will become more precise, shedding light on whether the data are pointing to different explanations for the results we observe or the need to update our model. More data will also improve DESI’s other early results, which weigh in on the Hubble constant (a measure of how fast the universe is expanding today) and the mass of particles called neutrinos.


“DESI, even with just the data from its first year, is already the spectroscopic survey with most collected data in the history and it goes on increasing this quantity with one million galaxies per month”, said Eusebio Sánchez, a researcher at CIEMAT, Madrid. “This amazing data sample makes possible to measure the expansion history of the Universe with an unprecedented precision. We are sure that DESI will increase our knowledge about the Universe and perhaps will allow us to make revolutionary discoveries”.
DESI’s overall precision on the expansion history across all 11 billion years is 0.5%, and the most distant epoch, covering 8-11 billion years in the past, has a record-setting precision of 0.82%. That measurement of our young universe is incredibly difficult to make. Yet within one year, DESI has become twice as powerful at measuring the expansion history at these early times as its predecessor (the Sloan Digital Sky Survey’s BOSS/eBOSS), which took more than a decade.
Traveling back in time
DESI is an international collaboration of more than 900 researchers from over 70 institutions around the world. The instrument was constructed and is operated with funding from the DOE Office of Science, and sits atop the U.S. National Science Foundation’s Nicholas U. Mayall 4-meter Telescope at Kitt Peak National Observatory, a program of NSF’s NOIRLab.
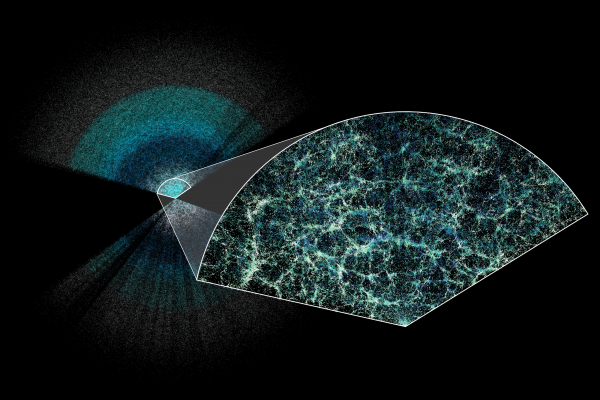
Looking at DESI’s map, it’s easy to see the underlying structure of the universe: strands of galaxies clustered together, separated by voids with fewer objects. Our very early universe, well beyond DESI’s view, was quite different: a hot, dense soup of subatomic particles moving too
fast to form stable matter like the atoms we know today. Among those particles were hydrogen and helium nuclei, collectively called baryons.
Tiny fluctuations in this early ionized plasma caused pressure waves, moving the baryons into a pattern of ripples that is similar to what you’d see if you tossed a handful of gravel into a pond. As the universe expanded and cooled, neutral atoms formed and the pressure waves stopped, freezing the ripples in three dimensions and increasing clustering of future galaxies in the dense areas. Billions of years later, we can still see this faint pattern of 3D ripples, or bubbles, in the characteristic separation of galaxies – a feature called Baryon Acoustic Oscillations (BAOs).
Researchers use the BAO measurements as a cosmic ruler. By measuring the apparent size of these bubbles, they can determine distances to the matter responsible for this extremely faint pattern on the sky. Mapping the BAO bubbles both near and far lets researchers slice the data into chunks, measuring how fast the universe was expanding at each time in its past and modeling how dark energy affects that expansion.
This animation shows how baryon acoustic oscillations act as a cosmic ruler for measuring the expansion of the universe. Credit: Claire Lamman/DESI collaboration and Jenny Nuss/Berkeley Lab
“DESI is already more precise than all previous BAO surveys over the whole cosmic history”, said Violeta González Pérez, a researcher at the Theoretical Physics Department of the Universidad Autónoma from Madrid. “Its data allow us to study cosmic mysteries that lie beyond our current understanding of the Universe”.
Using galaxies to measure the expansion history and better understand dark energy is one technique, but it can only reach so far. At a certain point, light from typical galaxies is too faint, so researchers turn to quasars, extremely distant, bright galactic cores with black holes at their centers. Light from quasars is absorbed as it passes through intergalactic clouds of gas, enabling researchers to map the pockets of dense matter and use them the same way they use galaxies – a technique known as using the “Lyman-alpha forest.”
“We use quasars as a backlight to basically see the shadow of the intervening gas between the quasars and us,” said Andreu Font-Ribera, a scientist at the Institute for High Energy Physics (IFAE) in Spain who co-leads DESI’s Lyman-alpha forest analysis. “It lets us look out further to when the universe was very young. It’s a really hard measurement to do, and very cool to see it succeed.”


Researchers used 450,000 quasars, the largest set ever collected for these Lyman-alpha forest measurements, to extend their BAO measurements all the way out to 11 billion years in the past. By the end of the survey, DESI plans to map 3 million quasars and 37 million galaxies.
State-of-the-art science
DESI is the first spectroscopic experiment to perform a fully “blinded analysis,” which conceals the true result from the scientists to avoid any subconscious confirmation bias. Researchers work in the dark with modified data, writing the code to analyze their findings. Once everything is finalized, they apply their analysis to the original data to reveal the actual answer.
"The fact that the analysis was carried out using data-blinding techniques provides us with an extra level of confidence in the results obtained," says Héctor Gil Marín, researcher at the Institute of Cosmos Sciences of the University of Barcelona (ICCUB) and the Institut d’Estudis Espacials de Catalunya (IEEC). Blind analyses are already standard practice in fields such as experimental particle physics or clinical studies. Gil-Marín and other researchers at ICCUB have developed and implemented what turned out to be a very robust and difficult-to-decipher way to conceal the results of galaxy clustering in DESI until the analysis is completed. "We are confident that the extra effort involved in this will enhance the confidence and integrity of the DESI results," says Gil-Marín.
DESI’s data will be used to complement future sky surveys such as the Vera C. Rubin Observatory and Nancy Grace Roman Space Telescope, and to prepare for a potential upgrade to DESI (DESI-II) that was recommended in a recent report by the U.S. Particle Physics Project Prioritization Panel.
“It is exciting to see how the DESI results provide a precise view of how the Universe is” mentioned Francisco Javier Castander, a researcher of the Instituto de Ciencias del Espacio (ICE-CSIC) and the Institut d’Estudis Espacials de Catalunya (IEEC). “Moreover, this is only the beginning, with the new data we are gathering our measurements will be even more precise”.
DESI is supported by the DOE Office of Science and by the National Energy Research Scientific Computing Center, a DOE Office of Science user facility. Additional support for DESI is provided by the U.S. National Science Foundation; the Science and Technology Facilities Council of the United Kingdom; the Gordon and Betty Moore Foundation; the Heising-Simons Foundation; the French Alternative Energies and Atomic Energy Commission (CEA); the National Council of Humanities, Sciences, and Technologies of Mexico; the Ministry of Science and Innovation of Spain; and by the DESI member institutions.
The DESI collaboration is honored to be permitted to conduct scientific research on Iolkam Du’ag (Kitt Peak), a mountain with particular significance to the Tohono O’odham Nation.
Spanish participant institutions in DESI include the Centro de Investigaciones Energéticas, Medioambientales y Tecnológicas (CIEMAT), the Instituto de Ciencias del Espacio (ICE-CSIC), the Institut de Ciències del Cosmos de la Universitat de Barcelona (ICCUB), the Institut de Física d'Altes Energies (IFAE), the Instituto de Física Teórica (IFT - UAM/CSIC), the Instituto de Astrofísica de Andalucía (IAA) and the Instituto de Astrofísica de Canarias (IAC).
A complete list of participant institutions and more information about DESI is available in: https://www.desi.lbl.gov.